How to Use
Sort Button (above the table)
- By Popularity — Sorts by the number of tag clicks (cumulative total over the past 60 days), from most to least.
- Trending This Week — Ranked by click growth compared to last week. Species that suddenly attracted attention in the past 7 days appear at the top.
- Trending This Month — Ranked by growth rate compared to last month. Shows which species have surged in interest this month.
The top 5 species are marked with badges to the right of their names: 👑 (popular) 🔥 (this week) 📈 (this month). The current sort key is indicated by ●.
Month header buttons
Clicking a month column header re-sorts the list to show species most frequently recorded in that month. The ranking is based on heatmap intensity (relative value within each species); ties are broken by total photo count. For example, clicking "January" brings the species most commonly recorded in January to the top.
Area selection
Use the dropdown at the top of the page to switch areas. The statistics will be recalculated using only photos taken within that area, letting you check occurrence trends for each location — Ishigaki Island, Yonaguni Island, Okinawa Main Island, and more.
Clicking a species name or cell
'Clicking a species name or a heatmap cell takes you to that species\' detail page, which includes a monthly chart and a map of where it was photographed.'
| Species | ||||||||||||
|---|---|---|---|---|---|---|---|---|---|---|---|---|
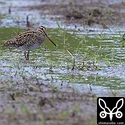 Swinhoe's Snipe
👑
🔥
📈
Swinhoe's Snipe
👑
🔥
📈
|
||||||||||||
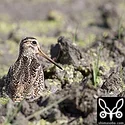 Pin-tailed Snipe
👑
📈
Pin-tailed Snipe
👑
📈
|
||||||||||||
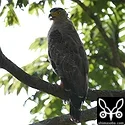 Crested Serpent Eagle
 Ruddy Kingfisher
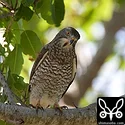 Grey-faced Buzzard
 Ryukyu Scops Owl
 Common Snipe
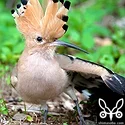 Eurasian Hoopoe
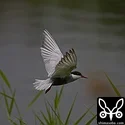 Whiskered Tern
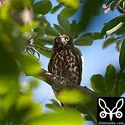 Northern Boobook
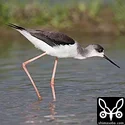 Black-winged Stilt
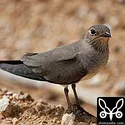 Oriental Pratincole
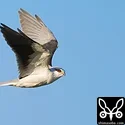 Black-winged Kite
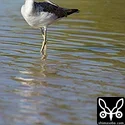 Common Greenshank
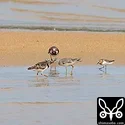 Red-necked Stint
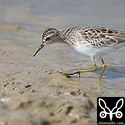 Long-toed Stint
About this data
Overview
This heatmap aggregates approximately 18 years of observation data recorded since around 2008. Using the date, time, and GPS information embedded in each photo, it calculates monthly occurrence trends for each species. Observations were conducted year-round, primarily on Okinawa Main Island, Ishigaki Island, and Yonaguni Island.
How the data is compiled
- Photos with recorded date/time and GPS data are included in the aggregation, and the number of photos per month is tallied for each species.
- 'Monthly photo counts for each species are normalized relative to that species\' peak month (set to 1.0) and reflected in the heatmap shading.'
- 'When an area is selected, only photos taken within that area\'s polygon boundary are used in the recalculation.'
- Records from breeding sites, private land, or restricted areas are excluded from map plots.
- Photos from the past 10 days are excluded from the aggregation to account for import delays.
About data bias
Because this dataset reflects the observations of a single person, shifts in personal interest and shooting style have influenced the data. For example, in the early days of recording I actively sought out Ruddy Kingfishers, Crested Serpent Eagles, terns, and owls, whereas now the focus has shifted toward establishing reliable identification methods for snipes. The fewer records a species has, the less reliable the statistics are. I also make a point of tracking species likely to interest visiting birdwatchers from outside the islands, but please treat this data as a general guide rather than a definitive reference.
For birding in Okinawa and the Sakishima Islands
'Thanks to their subtropical ecosystems and geographic location, Ishigaki Island, Yonaguni Island, and Okinawa Main Island are vital stopover sites for migratory birds and rank among Japan\'s premier birdwatching destinations.
I hope this data helps you plan when and where to go to find the species you\'re looking for.'